Texas Instruments (TI) faced a turbulent 2025 — tariffs, triple price hike rumors, and anti-trust investigations kept the industry alert. Yet TI’s latest financial results revealed a strong recovery: 2025 revenue grew 13% year-over-year, and Q1 2026 guidance exceeded market expectations, pushing post-market stock up by 8%. Analysts note this signals the analog chip inventory adjustment has ended and the demand recovery has begun.
But has this growth translated to the spot market? This article dissects TI’s 2025 performance, highlights which segments drove recovery, and evaluates ongoing trends affecting spot market dynamics.
TI 2025 Revenue Recovery: Key Milestones
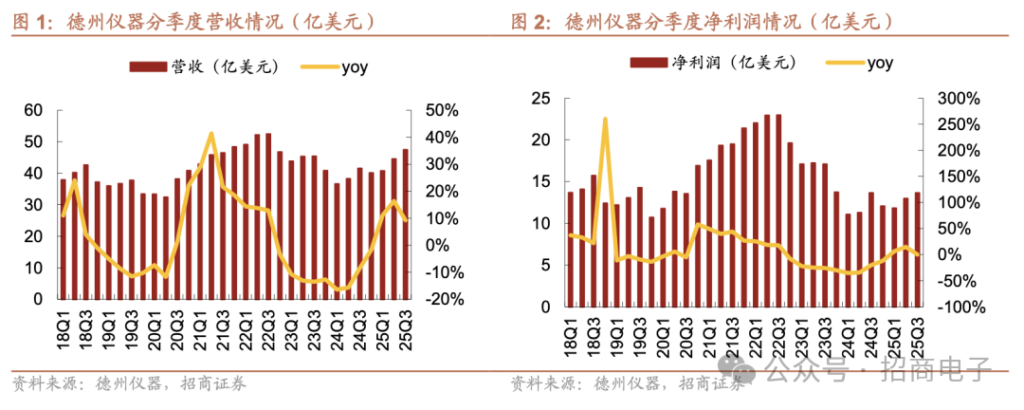
TI’s Q4 2025 revenue reached $4.423 billion, up 10% YoY but down 7% QoQ, slightly below expectations of $4.44 billion. The decline was driven by weak demand in smartphones, PCs, and tablets. Net income fell 3% YoY to $1.16 billion.
Analogue business led the recovery with 14% YoY growth, embedded processing up 8%, while other segments declined.
On a full-year basis, 2025 revenue hit $17.682 billion (+13% YoY), slightly above 2023’s $17.5 billion, reversing the 11% decline in 2024 ($15.6 billion).
TI’s revenue had been pressured since Q4 2022 (-3% YoY) and remained weak through 2023–2024. The first quarter of 2025 (+11.1% YoY) marked a key turning point in the recovery.
Segment Performance and Market Highlights
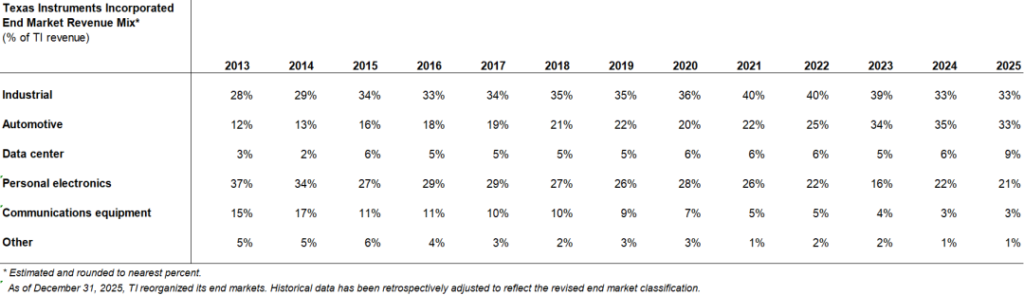
TI 2025 reorganized end-market reporting into five categories: Industrial, Automotive, Data Center, Personal Electronics, and Communication Equipment.
- Industrial & Automotive: Each 33% of revenue. Industrial revenue $5.8B (+12%), Automotive $5.8B (+6%). Rising EV adoption and sensor demand drove growth.
- Personal Electronics: $3.7B (+7%), but Q4 QoQ -7% due to weak smartphones, PCs, and tablets demand.
- Data Center: $1.5B (+64%), the fastest-growing segment, driven by cloud computing and AI server expansion. Q4 growth +70% YoY.
- Communication Equipment: $0.5B (+20%), minor share of total revenue.
TI’s inventory at Q4 2025 reached $4.8B, turnover days 222. Management emphasizes strategic stock positioning rather than overstock pressure.
Gross margin remains under pressure: TTM 2025 ~57%, below historical highs, indicating revenue recovery precedes margin rebound.
Capital expenditure in 2025 was $4.6B; 2026 is projected at $2–3B. The new 12-inch wafer fab in Sherman, TX, started production in late 2025, sustaining long-term capacity and cost structure advantages.
Spot Market Dynamics: Fluctuations, Not Heat
Despite corporate recovery, TI’s spot market remained muted:
- Q1 2025 saw slight demand increase, cautious buyers, and strict quality requirements.
- Q2 2025 tariff concerns triggered brief panic-buying; prices spiked temporarily.
- Three rumored price hikes in June–August affected over 60,000 part numbers, but real transaction volumes remained low.
- Anti-trust investigations in September and distributor restrictions (BIS listing) had limited spot market impact; demand stayed selective, competitive pricing persisted.
- Data Center-driven demand led Q4 2025, but broader spot market heating did not occur.
Overall, TI’s 2025 spot market was volatile but relatively quiet; direct sales and domestic alternatives reduced TI’s market presence in the secondary market.
Revenue vs. Spot Market: Key Insights
| Factor | Corporate Impact | Spot Market Impact | Notes |
|---|---|---|---|
| Revenue growth | +13% YoY | Limited | Recovery concentrated in Industrial, Automotive, Data Center |
| Gross margin | 57% TTM | N/A | Margins still under pressure |
| Inventory | $4.8B, 222 days | Strategic positioning | Supports future demand, not short-term sales spike |
| Price rumors & anti-trust | Minor impact | Short-lived spikes | Mostly observed, low conversion to orders |
| Data Center demand | High growth | Moderate | Key driver of revenue but limited broad market effect |
Key Takeaways
- TI’s corporate recovery is real but uneven across segments.
- Data Center is the growth engine; Industrial and Automotive are stabilizing.
- Spot market heating is limited; rumors cause short-term volatility but not broad order acceleration.
- TI’s direct sales and growing domestic alternatives reduce its spot market presence.
- Strategic inventory and capex positioning ensure long-term resilience.
For distributors and overseas factories, monitoring segment-specific demand and alternative suppliers remains crucial to avoid overreliance on TI spot pricing.
7setronic can assist overseas clients with verified TI alternatives, strategic stock analysis, and sample sourcing to ensure production continuity while navigating spot market uncertainties.
FAQ
Q1: Has TI’s recovery driven spot market growth?
Not significantly; most growth is corporate, spot market remains selective.
Q2: Which TI segment is fastest growing?
Data Center, with +64% revenue growth in 2025.
Q3: How should buyers mitigate risk?
Consider alternative suppliers, strategic inventory, and sample validation.