In electronics manufacturing, BOM cost is not just a purchasing number. It directly determines product pricing flexibility, profit margin stability, and supply chain resilience. For small and mid-sized factories, BOM often represents 60–85% of total product cost. A structured effort to optimize BOM to reduce cost can therefore create measurable margin improvement without increasing sales volume.
However, many companies approach BOM optimization as simple price negotiation. In reality, effective BOM optimization to reduce cost requires structural analysis, component standardization, lifecycle planning, and risk-controlled alternative sourcing. When properly executed, manufacturers typically achieve 3–10% BOM cost reduction while improving supply stability.
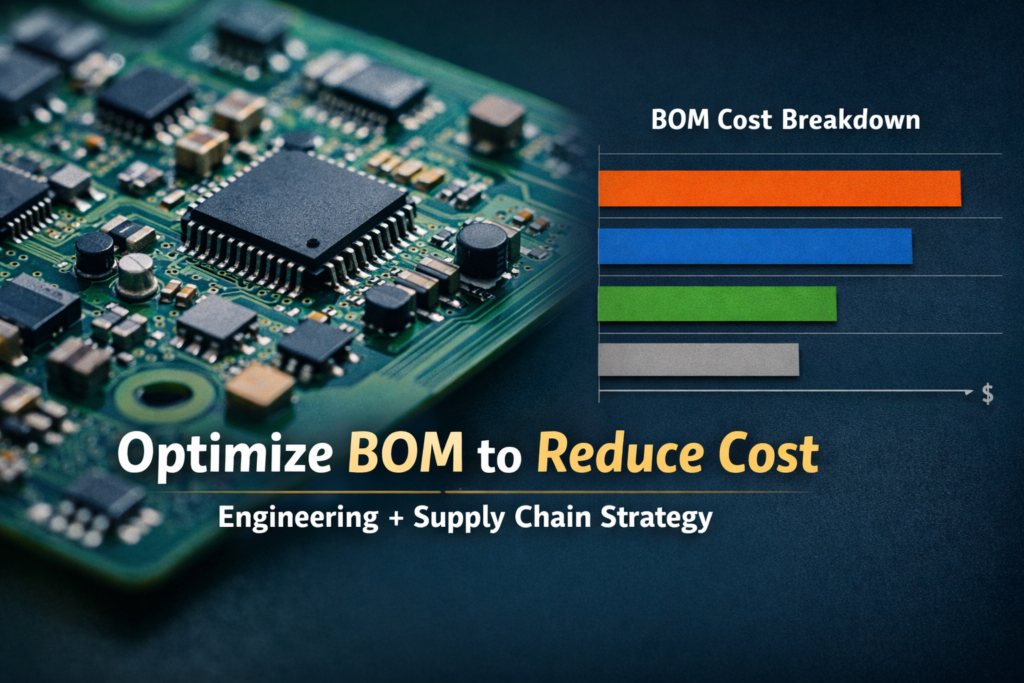
This guide explains how to optimize BOM to reduce cost using practical engineering and supply chain strategies.
Understanding Where BOM Cost Really Sits
Before attempting to optimize BOM to reduce cost, manufacturers must analyze cost distribution.
In most industrial electronics products:
- 15–25% of components account for 70–80% of BOM value
- MCU, memory, power devices, and connectors dominate cost
- Passive components dominate quantity but not total value
For example, in a 4-layer industrial control board with 180 components:
- MCU + memory represented 38% of total BOM cost
- Power stage (MOSFET + driver + inductors) represented 22%
- Remaining 150+ passive components accounted for less than 15%
This data pattern is consistent across consumer electronics, industrial control systems, and IoT products.
Cost reduction effort must focus on high-value components first. Attempting to optimize 0.1% resistors rarely delivers meaningful impact.
Standardization as a Core Strategy
Component standardization is one of the most effective long-term methods to optimize BOM to reduce cost.
When multiple product lines use different but similar components:
- Procurement volume is fragmented
- Negotiation leverage weakens
- Inventory variety increases
- Risk exposure multiplies
By unifying resistor series, capacitor voltage ratings, and even MCU platforms across models, manufacturers often reduce purchasing cost by 5–12% over a 12-month period.
In one mid-sized automation factory (annual production 80K units across 5 SKUs), consolidating three LDO regulators into one widely available industrial-grade model reduced total annual purchasing cost by 9% and simplified inventory control.
Standardization improves pricing power and reduces operational overhead simultaneously.
Controlled Alternative Component Qualification
Single-source dependence is one of the most expensive hidden risks in BOM structure.
To optimize BOM to reduce cost sustainably:
- Identify high-value components
- Validate drop-in second sources
- Test electrical and thermal compatibility
- Document cross-reference matrix
A practical case:
An industrial lighting controller using a single-brand MOSFET faced a 14-week lead time surge. After qualifying two equivalent manufacturers, unit price dropped by 11%, and lead time normalized to 6 weeks.
Dual-source validation not only reduces cost but protects production continuity.
7setronic frequently supports overseas factories by providing cross-brand comparison analysis, lifecycle validation, and sample coordination to accelerate this process.
Reducing Over-Specification in Engineering Design
Over-specification is common in early-stage engineering.
Examples frequently seen:
- 50V capacitors used in 12V circuits
- 1% precision resistors used in non-critical signal paths
- High-performance MCU selected for simple logic control
While safety margin is necessary, excessive margin inflates BOM unnecessarily.
Engineering review often identifies 3–8% potential cost reduction through controlled specification adjustment without affecting reliability.
Thermal simulation, tolerance review, and voltage stress validation should guide de-spec decisions rather than intuition.
Lifecycle and Market Stability Evaluation
Optimize BOM to reduce cost must consider lifecycle stage:
- Active
- Mature
- NRND
- End-of-life
Selecting low-priced but unstable components may trigger redesign cost later, which often exceeds initial savings.
In recent semiconductor cycles, memory and power device pricing fluctuated by 15–40% within one year. Manufacturers with diversified sourcing and lifecycle awareness were significantly less exposed to volatility.
Stable components reduce total cost of ownership, not just purchase price.
Supplier Consolidation and Logistics Efficiency
Many small factories source from multiple fragmented suppliers.
Hidden costs include:
- Higher freight cost
- Increased customs handling
- More quality variance
- Administrative overhead
Consolidated sourcing models can reduce total landed cost by 5–12%, particularly for overseas factories requiring cargo integration.
When we optimize BOM to reduce cost, logistics structure should be evaluated alongside component pricing.
7setronic supports consolidated component supply across active and passive categories, helping factories reduce freight complexity and transaction overhead.
Cost Optimization Comparison Table
| Optimization Method | Cost Impact | Implementation Difficulty | Risk Level | Typical Saving |
|---|---|---|---|---|
| Component Standardizatibomon | High | Medium | Low | 5–12% |
| Alternative Qualification | High | Medium | Medium | 5–15% |
| De-Spec Review | Medium | Medium | Low | 3–8% |
| Supplier Consolidation | Medium | Low | Low | 5–12% |
| PCB Design Optimization | High | High | Medium | 8–18% |
This structured approach helps manufacturers prioritize high-impact actions rather than random price negotiation.
Strategic View: BOM Optimization Is a Structural Discipline
To truly optimize BOM to reduce cost, companies must combine engineering, procurement, and supply chain strategy.
Short-term price pressure may deliver temporary savings. Structural BOM optimization creates long-term competitiveness.
For small and mid-sized overseas factories, systematic BOM analysis typically results in:
- 3–10% cost reduction
- Improved supply stability
- Lower emergency purchasing
- Stronger negotiation leverage
If you are reviewing your BOM for cost reduction, structured cross-brand analysis and lifecycle validation can significantly accelerate your decision process. 7setronic works with overseas factories to support verified alternatives, cost comparison models, and consolidated supply solutions.
Cost reduction should increase stability, not create new risks.
FAQ
Q1: How much can BOM optimization reduce cost?
Most structured projects achieve 3–10% reduction.
Q2: Is switching components risky?
Only without validation. Proper testing minimizes risk.
Q3: Should small factories qualify second sources?
Yes. It improves cost control and